New detailed results launched for group admins
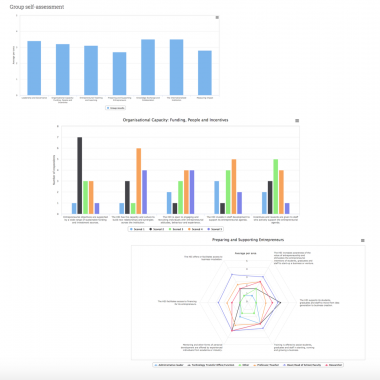
Group admins can now access more detailed Group self-assessment results from the new look Group Results page.
The group function of HEInnovate is the best way for higher education institutions to use the self-assessment for institutional change as it can help explore key differences in opinion, aid setting priorities and actions, as well as highlight areas of good practice across the institution.
With the update group admins can now view and download the Group self-assessments results as tailored ready made charts as well. In addition to the previously available basic “Group self-assessment” average graph focusing, group admins can now view and download new bar graphs and spider diagrams for each dimension breaking down results further into type of respondents and number of scores.
To view the new display, login into your account and go to My Groups in your dashboard. Select a group you manage and click View Group Results.
Once here, group admins can control the results displayed by clicking on individual dimensions in the basic chart (Group self-assessment) or using the drop-down menu “Select a dimension”. Additionally, admins can also click on the item(s) in the legend to temporarily hide/show related data from the chart.
We hope that you will find the new feature useful! If you have any questions about the new display, do not hesitate to get in contact through the info@heinnovate.eu e-mail address.
Best regards
The HEInnovate Team

